Fishbone Diagram Explained: Solve Any Problem Like a Six Sigma Expert
Learn Fishbone Diagram in Six Sigma with simple examples, steps, and expert tips. A practical guide for engineers & students to solve root causes easily.
🔍 Introduction: Are you fixing problems… or just managing them?
Let me share something from real project experience.
We had a recurring issue in the plant. Every time we fixed it, the problem came back after a few days.
At first, it felt like we were solving it—but in reality, we were just applying temporary fixes.
That’s when we used the Fishbone Diagram in Six Sigma.
And honestly, it completely changed how we approached problem-solving.
Instead of guessing, we started finding the actual root cause.
🧠 What is Fishbone Diagram in Six Sigma?
A Fishbone Diagram is a visual problem-solving tool used to identify the root causes of a problem.
Fishbone Diagram ek simple visual tool hai jo kisi problem ke root cause (asli wajah) identify karne me help karta hai.
Isko 3 naam se jaana jata hai:
- Fishbone Diagram
- Ishikawa Diagram
- Cause-and-Effect Diagram
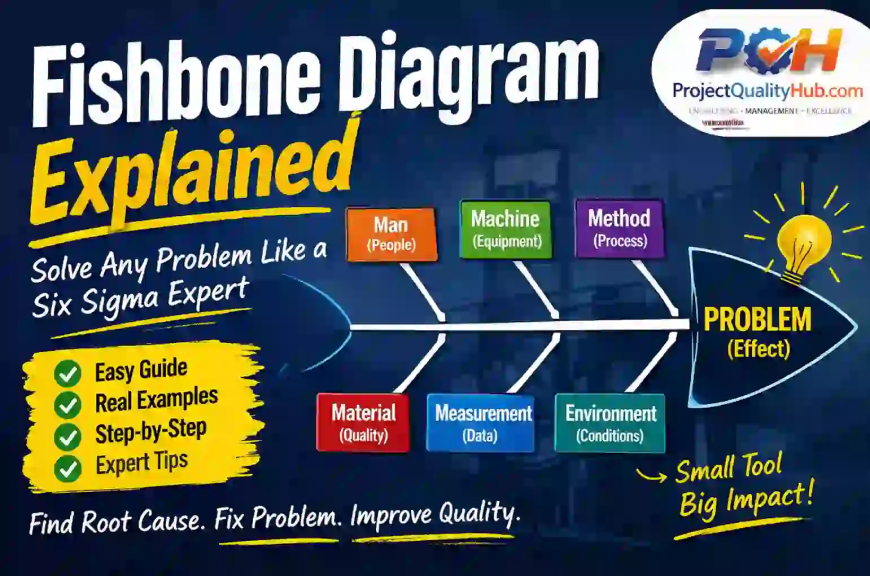
👉 It looks like a fish:
- Head → Problem
- Bones → Main causes
- Smaller bones → Sub-causes
👉 In simple terms:
It helps you go beyond surface-level issues and find the real reason behind a problem.
⚙️ Why is Fishbone Diagram Important in Six Sigma?
The main goal of Six Sigma is:
✔ Reduce defects
✔ Improve process performance
Fishbone Diagram helps you:
- Eliminate guesswork
- Think logically and systematically
- Improve team collaboration
👉 Simple idea:
Clear cause = Strong solution
🧩 Main Categories in Fishbone Diagram (6M Approach)
In engineering and manufacturing, we usually use the 6M categories:
1. Man (People)
Skills, training, human error
2. Machine
Equipment issues, maintenance problems
3. Method
Process design, SOP gaps
4. Material
Quality or specification issues
5. Measurement
Incorrect data or instrument errors
6. Mother Nature (Environment)
Temperature, humidity, working conditions
👉 These categories make sure you don’t miss any possible cause.
🛠️ Step-by-Step: How to Create a Fishbone Diagram
Step 1: Define the Problem Clearly
Example: “Surface defect in steel plate”
👉 Be specific. A vague problem leads to weak analysis. Means... Problem clear nahi hoga toh analysis bhi weak hoga.
Step 2: Draw the Fishbone Structure
- Right side → Problem
- Left side → Main categories (6M)
Step 3: Brainstorm Possible Causes
Discuss with your team:
- Is it a machine issue?
- Is it a process issue?
- Is it human error?
👉 Ask “Why” multiple times (use the 5 Why technique)
Step 4: Add Sub-Causes
Example:
- Machine → Low pressure
- Method → Incorrect setup
Step 5: Identify the Root Cause
Focus on the most impactful and validated cause.
Step 6: Take Corrective Action
Implement the solution and monitor results.
🏭 Real-Life Example (Engineering Case)
Problem: Descaling system not working effectively
Fishbone analysis revealed:
- Machine → Pressure fluctuations
- Method → Incorrect nozzle angle
- Material → Uneven scale
👉 Root Cause: Improper nozzle alignment
Solution:
✔ Corrected alignment
✔ Adjusted pressure settings
👉 Result: Significant improvement in surface quality
✅ Advantages of Fishbone Diagram
✔ Easy to understand and apply
✔ Improves team discussion
✔ Provides clear visualization
✔ Helps identify root causes effectively
✔ Widely used in Six Sigma projects
❌ Disadvantages
✖ Can be time-consuming
✖ Depends on quality of input data
✖ Risk of over-analysis
✖ Requires some experience for best results
⚠️ Common Mistakes to Avoid
❌ Not defining the problem clearly
❌ Relying only on assumptions
❌ Ignoring data validation
❌ Not involving the right team members
👉 Key reminder:
Assumptions are not root causes... Assumption se problem solve nahi hoti.
💡 Expert Tips (From Real Experience)
✔ Combine Fishbone Diagram with 5 Why Analysis
✔ Always validate causes with data
✔ Involve cross-functional teams
✔ Keep the diagram simple and focused
✔ Test the root cause before final implementation
🔚 Conclusion: A Simple Tool with Powerful Impact
Fishbone Diagram in Six Sigma may look simple, but it is extremely powerful when used correctly.
If you are an engineer, student, or working professional, this tool can help you move from quick fixes to permanent solutions.
👉 Final thought:
Don’t just solve problems—understand them deeply. That’s where real improvement begins.
❓ FAQs
1. What is Fishbone Diagram in Six Sigma?
It is a tool used to identify the root causes of a problem in a structured way.
2. Where is Fishbone Diagram used?
It is used in manufacturing, quality control, healthcare, IT, and Six Sigma projects.
3. What is the difference between Fishbone and 5 Why?
Fishbone identifies multiple possible causes, while 5 Why explores one cause in depth.
4. Who developed the Fishbone Diagram?
It was developed by Kaoru Ishikawa.
5. Can beginners use Fishbone Diagram?
Yes, it is simple and beginner-friendly.