SIPOC Diagram in Six Sigma Explained Simply
Learn SIPOC Diagram in Six Sigma with simple examples, step-by-step guide & real insights. Perfect for engineers & students.
Introduction: Why SIPOC Still Matters Today
A few years back, during a project execution phase in a steel plant, we were stuck. Process delays, confusion between teams, and no clarity on inputs and outputs — sab kuch messy tha.
We had meetings, discussions, blame games… but no solution.
Then one senior engineer quietly said,
“Let’s start with SIPOC.”
Within 30 minutes, things became crystal clear.
That’s the power of a SIPOC Diagram in Six Sigma — simple, but game-changing.
What is a SIPOC Diagram in Six Sigma?
A SIPOC Diagram is a high-level process mapping tool used in Six Sigma methodology to understand a process from start to end.
SIPOC stands for:
- S – Suppliers (who provides inputs)
- I – Inputs (resources needed)
- P – Process (steps involved)
- O – Outputs (final product/service)
- C – Customers (who receives output)
👉 Simple language mein:
“Process ka full overview ek page pe.”
Why SIPOC is Used (Aur itna popular kyun hai?)
When you start a project, especially in Six Sigma (DMAIC phase), confusion hota hai:
- Process kaha se start hota hai?
- Kaun responsible hai?
- Output kya expected hai?
SIPOC answers all of these — quickly.
Key Benefits:
- Gives big picture clarity
- Helps align team understanding
- Identifies gaps and inefficiencies
- Improves communication between departments
SIPOC Diagram Structure (Easy Breakdown)
Think of SIPOC as a simple table:
| Suppliers | Inputs | Process | Outputs | Customers |
|---|
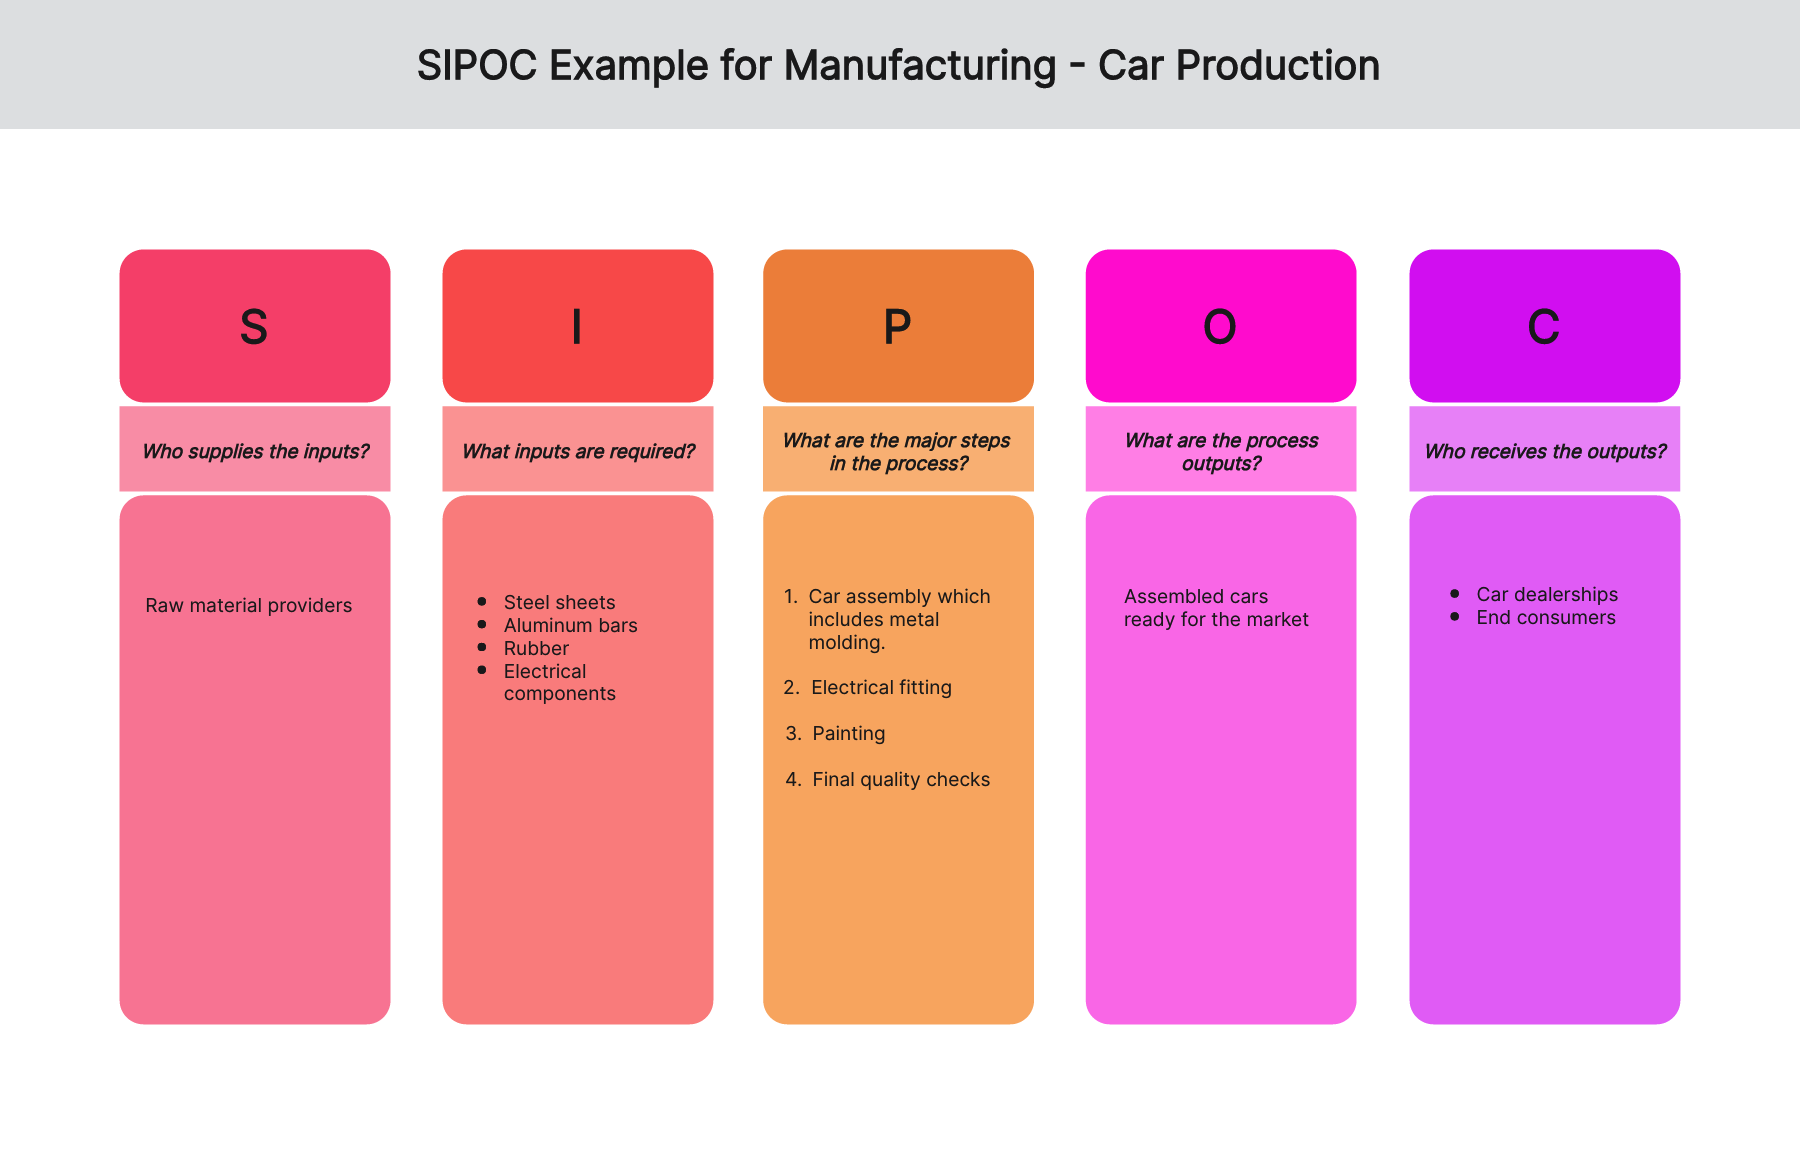
Example (Real-Life Manufacturing Context)
| Suppliers | Inputs | Process | Outputs | Customers |
|---|---|---|---|---|
| Vendor | Raw Material | Cutting → Welding → Inspection | Finished Product | Client |
👉 Dekha? Simple hai, but powerful.
Step-by-Step Guide: How to Create a SIPOC Diagram
Step 1: Define the Process
Start with clear boundaries.
Where does the process begin and end?
Step 2: List Process Steps
Keep it high-level (5–7 steps max).
Detail mein mat jao — SIPOC overview ke liye hai.
Step 3: Identify Outputs
Final result kya hai?
Step 4: Identify Customers
Kaun use karega output?
Step 5: Identify Inputs
Process ko chalane ke liye kya chahiye?
Step 6: Identify Suppliers
Inputs kaha se aa rahe hain?
👉 Pro Tip:
Always fill SIPOC from middle (Process → Outputs → Customers → Inputs → Suppliers)
Real-Life Example: Steel Plant Case Study
In a descaling system installation project:
- Problem: Delay in commissioning
- Root Cause: Misalignment between mechanical and electrical teams
SIPOC Created:
- Suppliers: Vendors, design team
- Inputs: Pumps, pipelines, drawings
- Process: Installation → Testing → Alignment
- Outputs: Functional system
- Customers: Production department
👉 Result:
- Clear responsibilities
- Reduced delays
- Smooth commissioning
Lesson:
Kabhi kabhi solution complex nahi hota — clarity hi enough hoti hai.
Advantages of SIPOC Diagram
✔ Easy to understand
✔ Quick to create
✔ Improves team communication
✔ Helps in problem-solving
✔ Useful for beginners in Six Sigma
Disadvantages (Reality Check)
❌ Not detailed (high-level only)
❌ Cannot replace detailed process maps
❌ Depends on team understanding
❌ Oversimplification ka risk
Common Mistakes (Jo log often karte hain)
- Too much detail add karna
- Process steps 10–15 likh dena
- Customers identify na karna
- Inputs aur outputs confuse karna
- Team discussion ke bina banana
👉 Remember:
SIPOC is for clarity, not complexity.
Myths About SIPOC
❌ “Only for Six Sigma experts”
✔ Reality: Beginners bhi use kar sakte hain
❌ “Time waste tool hai”
✔ Reality: Saves hours of confusion
❌ “Documentation ke liye hi hai”
✔ Reality: Real problem-solving tool
Expert Tips (From Real Experience)
⭐ Always create SIPOC with team
⭐ Use whiteboard first, not Excel
⭐ Keep language simple
⭐ Validate with stakeholders
⭐ Use it before starting any project
👉 Golden Rule:
If your SIPOC is not understandable to a new person, it’s wrong.
Conclusion: Why SIPOC Diagram is a Must-Learn Tool
The SIPOC Diagram in Six Sigma is not just a tool — it’s a mindset.
It teaches you to:
- See the complete picture
- Understand dependencies
- Avoid confusion and delays
Agar aap engineer ho, student ho, ya project manager —
SIPOC aapka best friend ban sakta hai.
Start using it in your next project — you’ll feel the difference.
FAQs (Frequently Asked Questions)
1. What is SIPOC in Six Sigma?
SIPOC is a process mapping tool that shows Suppliers, Inputs, Process, Outputs, and Customers.
2. When should SIPOC be used?
At the beginning of a project, especially during the Define phase of Six Sigma.
3. Is SIPOC only for manufacturing?
No, it can be used in IT, services, healthcare, and more.
4. How many steps should be in SIPOC?
Ideally 5–7 high-level steps.
5. What is the difference between SIPOC and process map?
SIPOC is high-level, while process maps are detailed.